
Why data should drive your digital decision-making
Last month, a client contacted us with a familiar request: “We need our e-commerce site upgraded so we can make more sales.” My immediate response? Let’s rebuild the checkout process, add some flashy new features, maybe throw in a chatbot for good measure.
Then I caught myself.
Here I was, falling into the same trap I’d spent years helping big-name companies avoid, jumping straight to solutions without understanding the problem. It was like prescribing medicine before taking the patient’s temperature.
So I did something that probably surprised our client: I said “no”. Not to helping them, but to guessing what would work. Instead, I suggested we spend 4-6 weeks figuring out what their customers were actually doing, not what we thought they were doing.
The difference between building and building right
Here’s the thing about running a successful business in Clermont, you don’t get there by guessing. You know your peak seasons, your best customers, and exactly when to order stock before the wet season hits. You make data-driven decisions every day, even if you don’t call them that.
So why should your digital strategy be any different?
At Clermont Digital, we bring the same rigour to building websites and digital tools that our clients bring to their own businesses. After all, you’re working with a proven CMO (Chief Marketing Officer) and CTO (Chief Technical Officer) team who’ve guided multi-million dollar brands through a multitude of transformations. The secret weapon? We let data guide our way in the digital world.
What we actually discovered (and why it matters)
Instead of diving straight into that website rebuild, we spent six weeks becoming digital detectives. We installed one of our toolkits to gather analytics on our client’s existing site. Think of it as taking the vital signs of their online business and being able to group the data into useful insights. Here’s what we found:
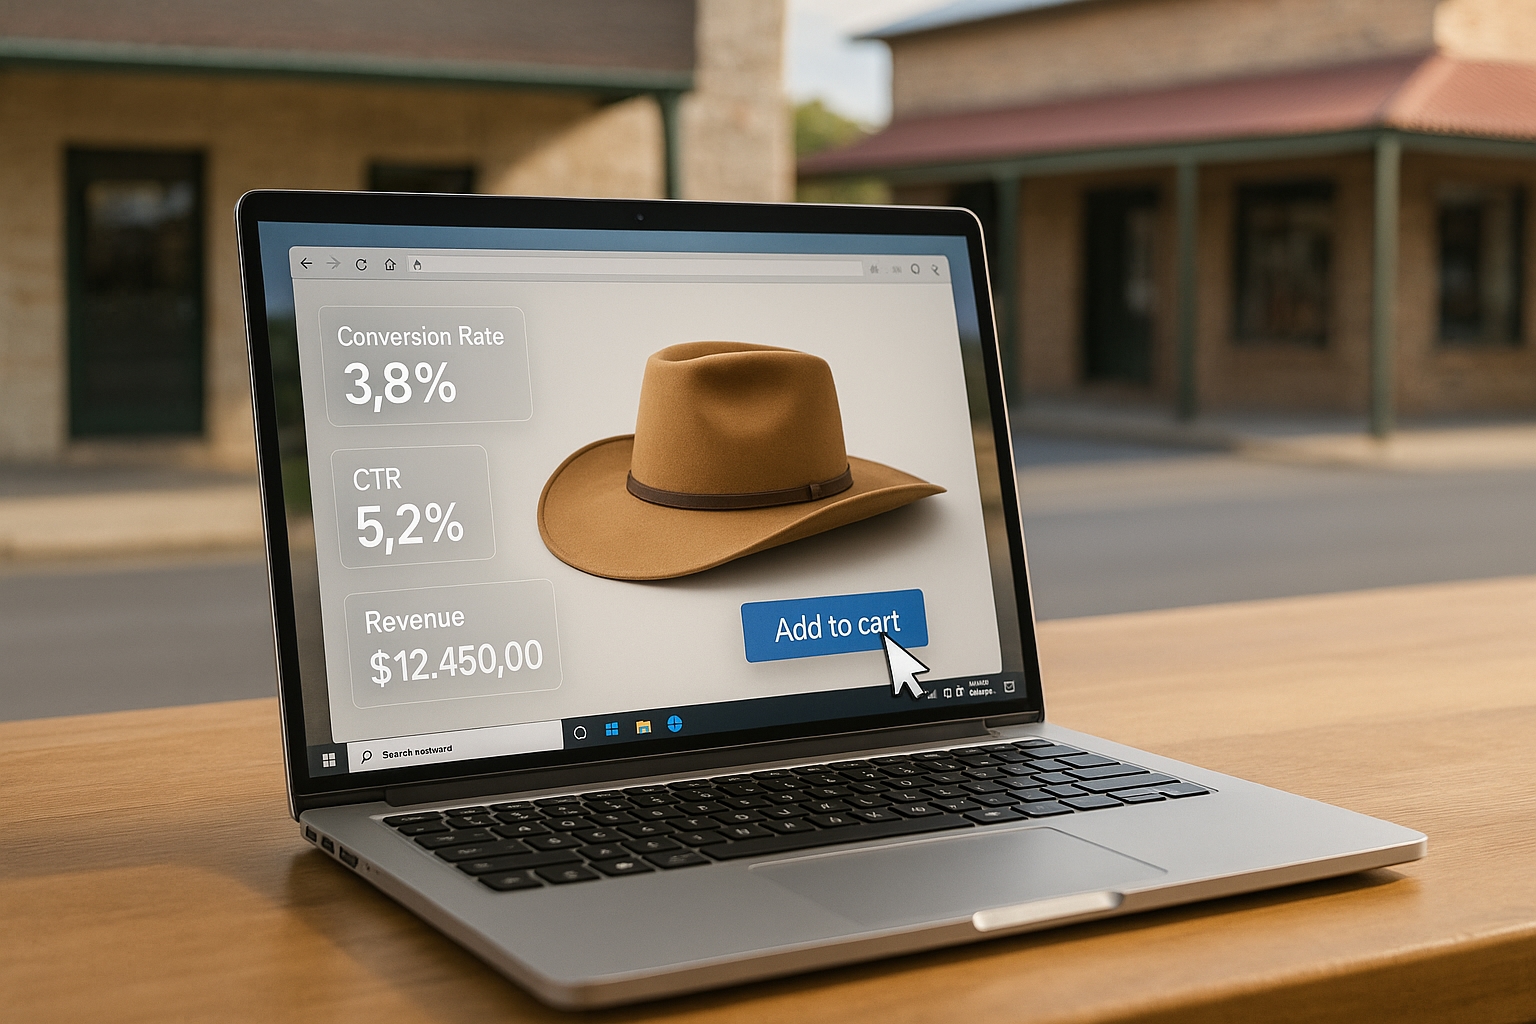
Their most significant assumption was wrong. They thought mobile users were bouncing because the site was slow. The reality? Desktop users were converting at 3x the rate of mobile users, but not because of speed, because of a tiny design issue that made the “Add to Cart” button practically invisible on phones.
Peak traffic wasn’t during business hours. Their customers were browsing at 7 PM on weekdays and Sunday afternoons, times when traditional retailers might assume everyone’s busy with dinner or family time.
The search terms bringing qualified customers were completely different from what they’d been optimising for. Instead of “buy [product name],” people were searching “how to fix [problem their product solved].”
One page was responsible for 40% of all customer drop-offs, and it wasn’t the checkout; it was the product details page. A simple layout change later, conversions improved by 23%.
Your digital crystal ball: the tools that tell the real story
The beauty of digital marketing is that everything leaves a trail. Every click, scroll, and abandoned cart tells a story about what your customers actually want, not what they say they want, but what they do.
Here’s the toolkit we now use before we touch a single line of code:
Google Analytics shows us who visits, from where, and what they do. It’s like having a conversation with every customer without the small talk. We can see whether your visitors are local farmers checking you out on their smoko break or city folk browsing from Brisbane on Sunday mornings.
Hotjar Heatmaps reveal where customers actually click and scroll. You might think that bright red “Buy Now” button is perfect, but heatmaps might show everyone is clicking on your logo instead, trying to get back to the homepage.
Google Search Console tells us what people are searching for to find you. This is gold for Clermont businesses; are people looking for “farm equipment Bowen Basin” or “agricultural supplies near me”? The difference changes everything about how you show up online.
PageSpeed Insights measures how fast your site loads. Because let’s be honest, internet speeds in regional Queensland aren’t always city-fast, and every second counts when someone’s trying to make a quick purchase from their phone in the middle of a paddock.
User Session Recordings let us watch real customers navigate your site. It’s like standing behind someone’s shoulder as they shop, seeing exactly where they get confused, frustrated, or excited.
What the data actually tells us
After six weeks of digital detective work and understanding the client’s current site, we ended up with intelligence that would make any business owner’s day:
Peak visitor times show us when your customers are actually online. Maybe it’s not 9-to-5 shopping—maybe it’s early morning coffee browsing or late evening research sessions.
Mobile versus desktop usage patterns reveal how differently people browse on phones compared to computers. Rural customers might research on a desktop computer but buy on mobile, or vice versa.
Drop-off points show us exactly where you’re losing potential customers. Is it during checkout? On the product page? At the very first click? Data shows us the exact spot where good intentions turn into lost sales.
Search behaviour reveals what terms bring you qualified leads versus just curious browsers. This distinction can transform your entire content strategy.
Technical issues that silently cost you sales get exposed. Maybe your site works perfectly on your office computer, but crashes on older phones. Maybe the contact form breaks every second Tuesday. Who knows? The data knows. Data catches what manual testing misses. This is where having a good understanding of your site’s vital signs allows you to spot emerging trends in your users and their preferences.
The Clermont advantage: local insights, enterprise tools
Here’s what makes our approach different from the agencies in the big cities: we understand the rhythm of regional business, but we bring enterprise-level analytical tools to the table.
We know that your customers might be checking your website from a mine site with patchy reception, or browsing on Saturday morning before heading to the golf course. We factor in Show day, wet season, and harvest schedules because these matter to your business, and they show up in your data.
But we also bring the same analytical rigour that we’d use for a multinational corporation. Because, whether you’re selling mining equipment or artisanal coffee, the principles of data-driven decision making are the same: understand before you build, measure before you optimise, and always let customer behaviour guide your strategy.
Your DIY data detective kit
Want to start understanding your own digital customers better? Here’s your beginner’s toolkit, most of it completely free:
Google Analytics 4 is your foundation for understanding user behaviour, traffic sources, and conversion tracking. Think of it as your digital cash register; it shows you not just who bought, but who browsed, what they looked at, and where they came from.
Google Search Console reveals your search performance, indexing issues, and keyword rankings. It’s like having a direct line to Google’s brain, showing you exactly how your site appears in search results.
Hotjar provides heatmaps, session recordings, and user behaviour analysis. The free version gives you plenty to start with, and watching real users navigate your site is more entertaining than you’d expect.
PageSpeed Insights measures website performance and Core Web Vitals. Google cares about site speed, and so do your customers, especially on mobile connections.
For local businesses, don’t forget Google My Business Insights for local search performance and Google Trends to understand what people in your area are searching for.
When to call in the cavalry
While you can absolutely start gathering insights on your own, there’s value in having someone who’s done this a few hundred times before. We’ve seen patterns across industries, caught sneaky technical issues that only show up under specific conditions, and know how to translate data into actionable strategies.
Our Basic Analytics Audit uses entirely free tools but applies years of experience to interpret what the numbers actually mean for your business. We spend six weeks monitoring, then deliver a clear roadmap of what to fix, what to build, and what to leave alone.
Our Premium Analytics Audit adds advanced tools for deeper insights; competitor analysis to see what’s working for similar businesses, enhanced heatmap analysis for granular user behaviour understanding, and sophisticated conversion tracking that shows the complete customer journey.
The real ROI of data-driven decision making
Here’s the bottom line: every business decision you make based on assumptions is a roll of the dice. Every decision you make based on data is an informed bet with much better odds.
That client who came in wanting a website upgrade? Six weeks of data analysis saved them $15,000 in unnecessary development costs and increased their conversion rate by 23% with three simple changes and a redesigned homepage. The return on investment of understanding their customers before building wasn’t just financial; it was strategic confidence.
Stop shooting in the dark
Your business is too important to build on guesswork. Whether you’re planning a website refresh, wondering why online sales have plateaued, or trying to figure out if that expensive digital marketing campaign is actually working, data has the answers.
The tools exist. The insights are waiting. The question is whether you’ll use them or keep guessing.
At Clermont Digital, we reckon real insights, not educated guesses, should back every business decision. Because in the digital world, just like in your business, success comes from knowing, not hoping.
Ready to stop guessing and start knowing what your customers actually want? Let’s dig into your data and build something that works.
👉 Contact us for an analytics consultation. We’ll show you what your current data is saying about your customers, and what it means for your business.